§ 01 · Case study · 2024
Big data ML pipelines
Operational analytics · forecasting & predictive maintenance
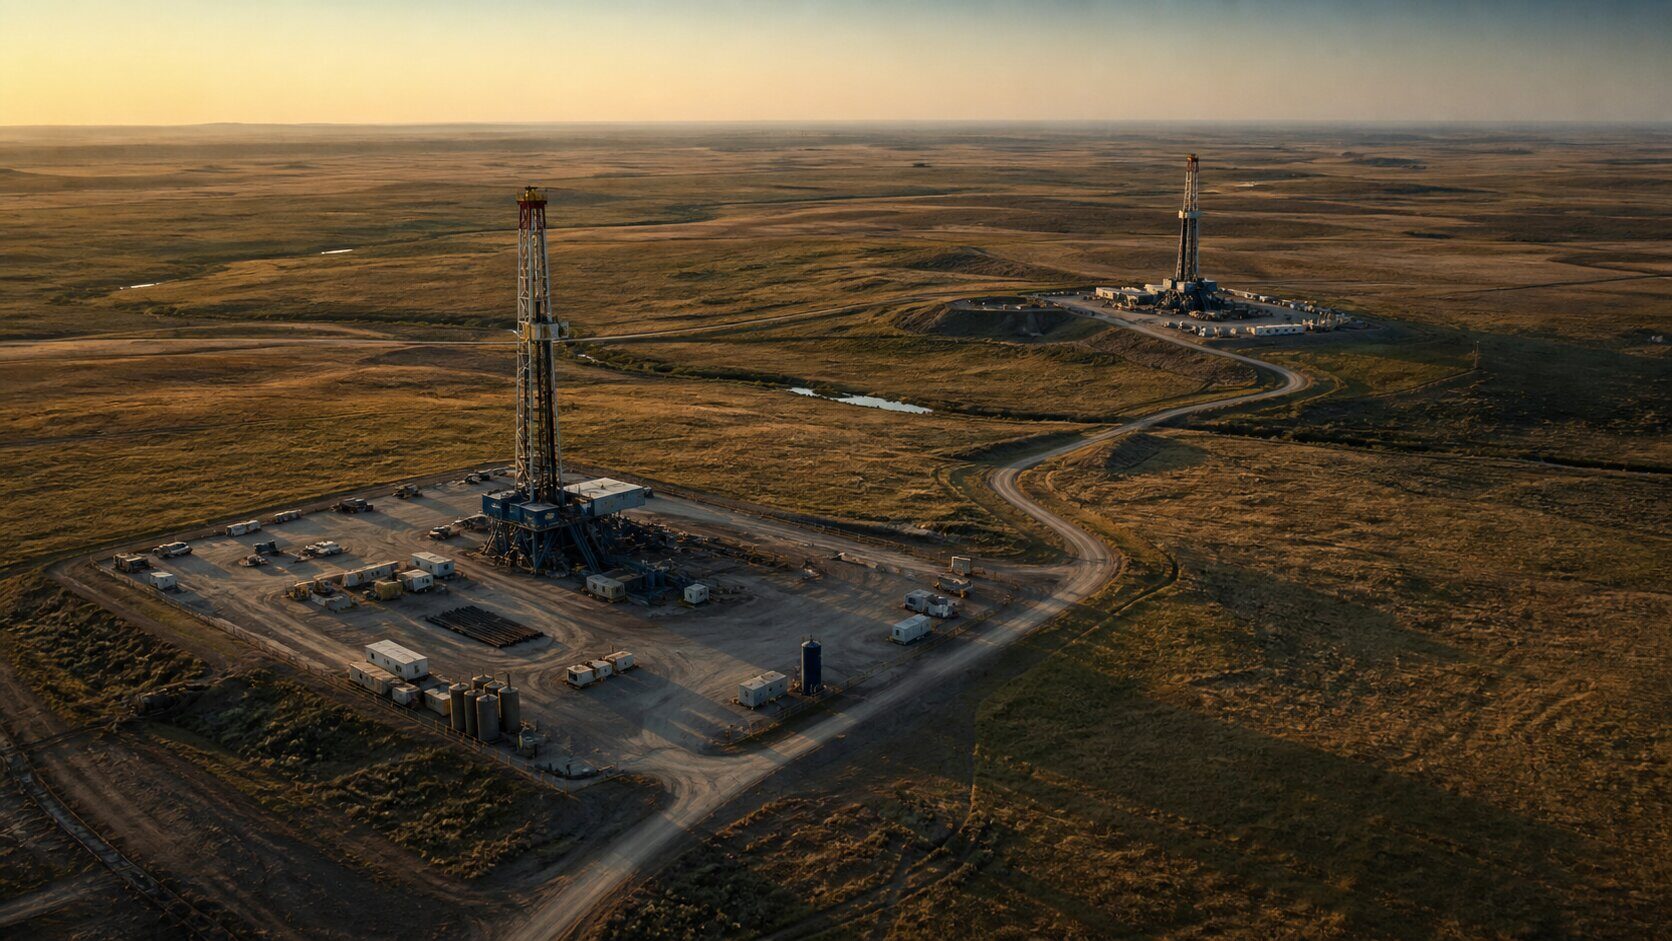
Cenovus Energy
Operational analytics, forecasting, and predictive maintenance for multi-facility field operations.
- Client
- Cenovus Energy
- Service
- Big data ML pipelines
- Year
- 2024
- Stack
- Python · gradient-boosted trees · RNNs · containerised cloud deploy
At a glance
Synopsis
We worked with Cenovus Energy on a data programme to lift the quality of operational decisions across multiple facilities. The work spanned data cleaning, feature engineering, model selection, training, deployment, and the daily reporting layer that engineers actually open in the morning.
The problem
What was in the way.
Operational data was arriving from a mix of sensor systems, field readouts, and raw logs across several Cenovus facilities. The data was usable in principle and broken in practice. Sampling cadence drifted between sites. Units were inconsistent. Whole windows were missing.
Anything sitting on top of that layer (forecasting, predictive maintenance, anomaly detection) was going to inherit the noise. Before any modelling could be trusted, the data layer had to be made boring.
The approach
How we built it.
We built a secure, end-to-end pipeline covering ingestion, normalisation, feature engineering, training, evaluation, deployment, and reporting. Python ETL handled the unification of cadences, units, and missingness, and produced features tuned for the downstream forecasting and maintenance tasks.
For the modelling layer, we evaluated gradient-boosted trees and recurrent neural networks across cross-validation folds, on a per-task basis. Each task got the model class that earned it on validation, not the one we liked on paper. Final models were containerised and deployed to cloud.
The outcome
What it does now.
Daily dashboards now surface forecasts and predictive maintenance flags to facility engineers, replacing manual rollups that used to consume real headcount. The reporting layer runs on schedule, the model layer runs on demand, and the data layer is no longer the bottleneck.
The team that used to spend a week assembling a report is now reviewing one.
Result
§ 01
Reporting cadence
Daily
automated dashboards across facilities, replacing manual rollups
Stack
Python · gradient-boosted trees · RNNs · containerised cloud deploy
What we did
- Data engineering
- Forecasting
- Predictive maintenance
- Cloud deployment
- MLOps
“GroupLabs demonstrated the utmost professionalism, delivering results efficiently.”